Comparing
Coastal BC Resorts
Comparing
Coastal BC Resorts
Figure 2 Change in winter snowfall (mm water equivalent) with elevation for Cypress, Mt Washington, Sasquatch, and Whistler Blackcomb ski resorts. Solid lines indicate the 1991-2020 average. Dotted lines are future forecasts generated by ClimateBC for 2090 based on the SSP5-8.5 emission scenario and an eight-member climate model ensemble with an equilibrium climate sensitivity of 3.4°C.

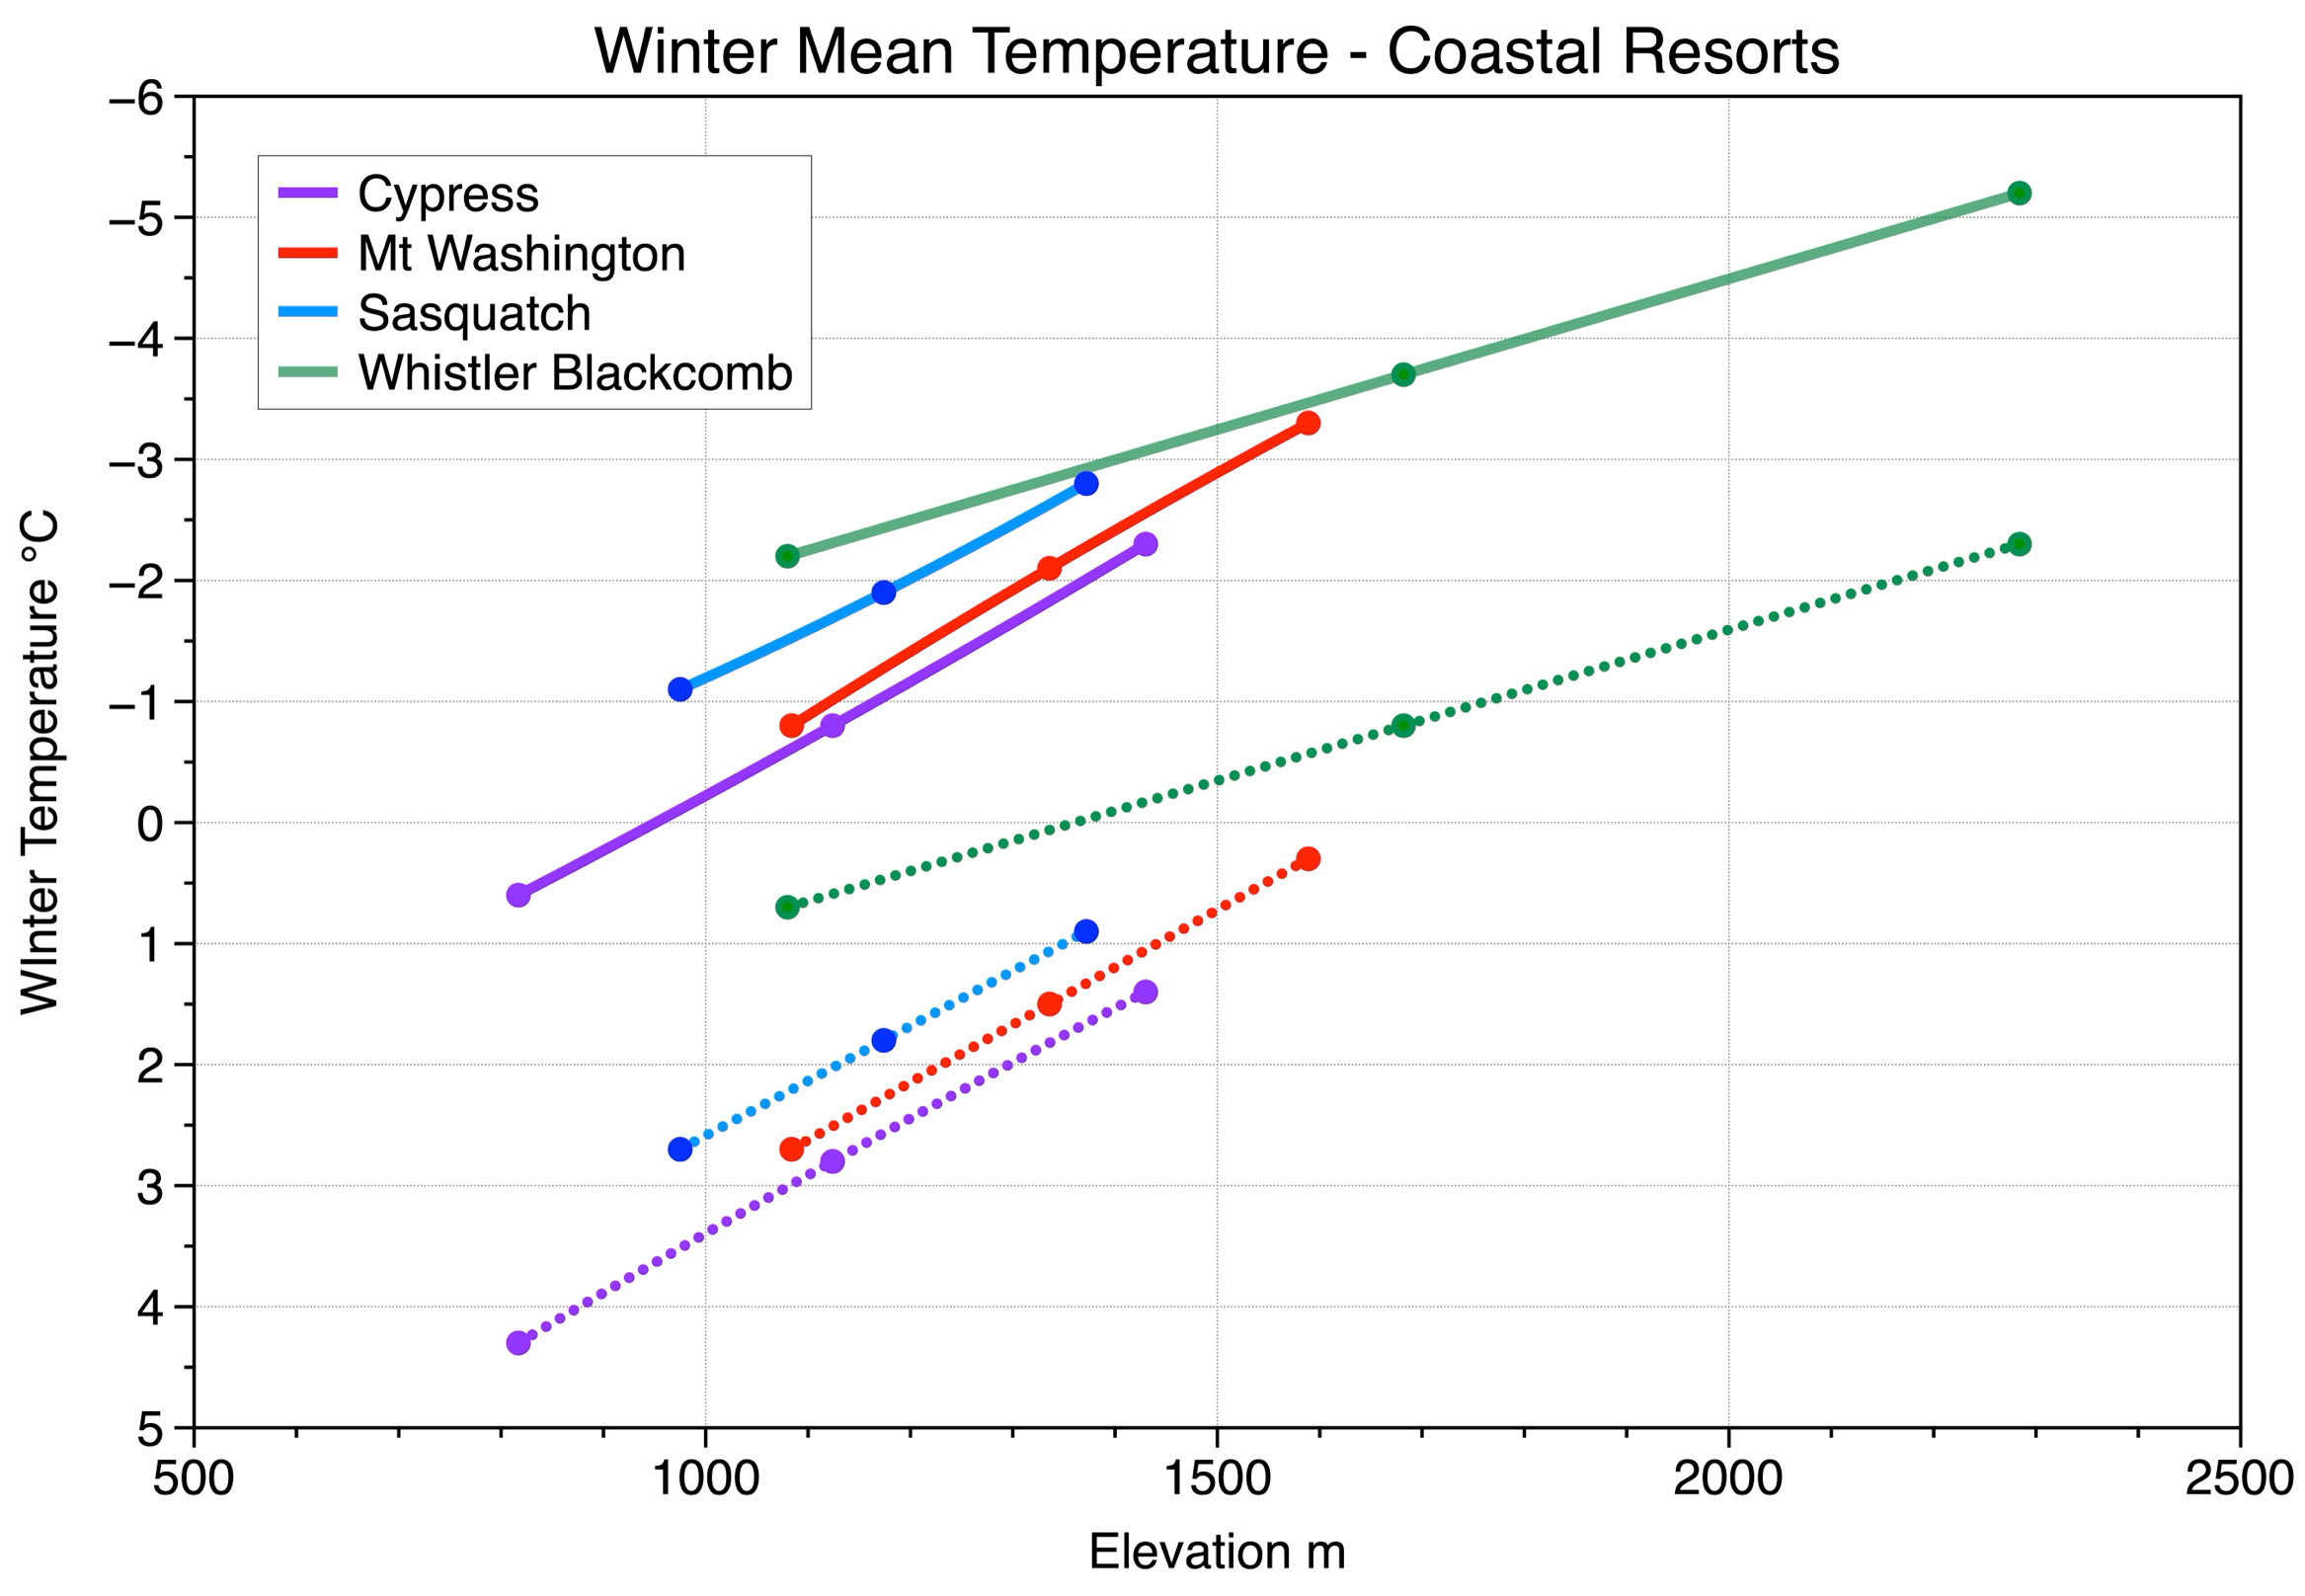
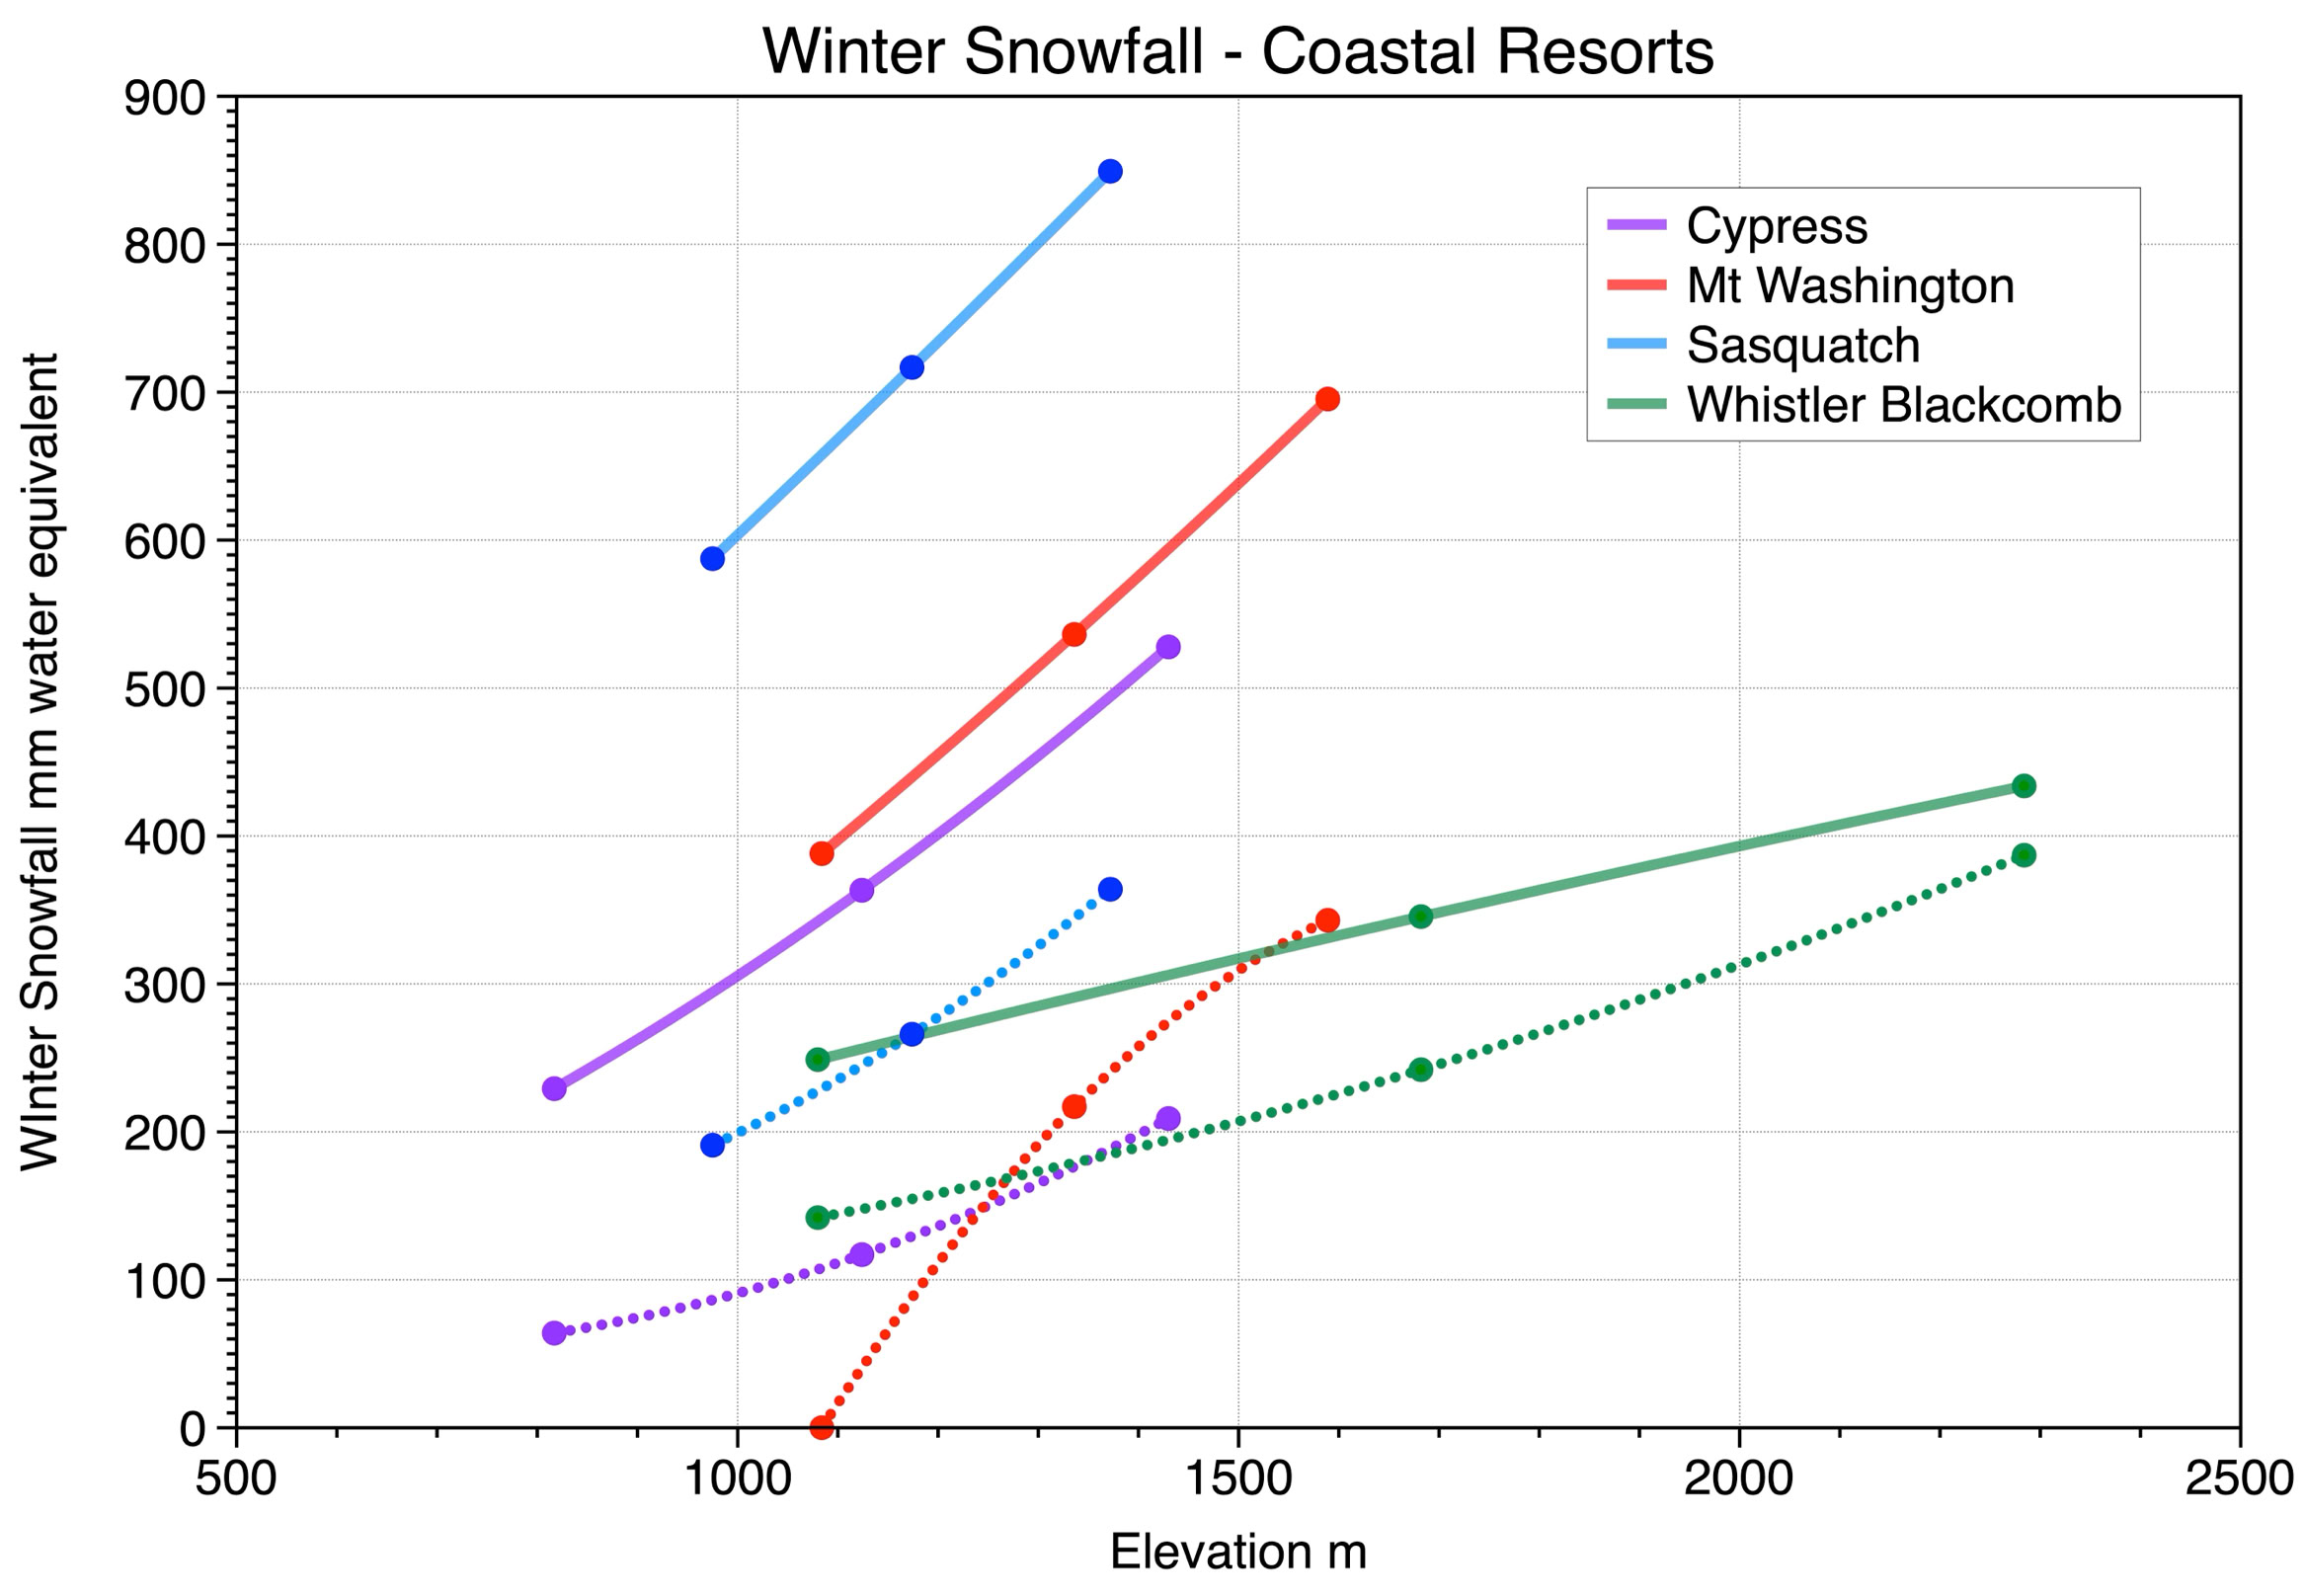
Figure 3 Change in winter rainfall (mm) with elevation for Cypress, Mt Washington, Sasquatch, and Whistler Blackcomb ski resorts. Solid lines indicate the 1991-2020 average. Dotted lines are future forecasts generated by ClimateBC for 2090 based on the SSP5-8.5 emission scenario and an eight-member climate model ensemble with an equilibrium climate sensitivity of 3.4°C.
Figure 1 Change in winter mean temperature (°C) with elevation for Cypress, Mt Washington, Sasquatch, and Whistler Blackcomb ski resorts. Solid lines indicate the 1991-2020 average. Dotted lines are future forecasts generated by ClimateBC for 2090 based on the SSP5-8.5 emission scenario and an eight-member climate model ensemble with an equilibrium climate sensitivity of 3.4°C.
Figure 1 compares the four coastal British Columbia ski resorts described on this website in terms of winter mean temperature. Two lines are shown for each resort showing the change in winter mean temperature with elevation: the average for 1991 to 2020 and the future forecast for 2090 based on the SSP5-8.5 emission scenario. Please note that the SSP5-8.5 is considered the worst-case emission scenario. The greatest temperature change between these two periods across all resort elevations will occur at Cypress, Mt Washington, and Sasquatch at about 3.6 to 3.7°C. Whistler Blackcomb is predicted to change by around 2.9°C.
Figure 2 compares the four coastal British Columbia ski resorts in terms of winter snowfall. Two lines are shown for each resort, showing the change in winter snowfall with elevation: the average for 1991 to 2020 and the future forecast for 2090 based on the SSP5-8.5 emission scenario. Cypress will experience around a 72 to 60% decrease in snowfall depending on elevation. Snowfall in the future at Mt. Washington will reach zero for its base elevation and decrease by 50% at its peak elevation. Sasquatch will experience a decline in snowfall between 68% at its base to 57% at its peak. Finally, Whistler Blackcomb snowfall is predicted to decrease by 43% at the base, 30% at mid-elevation, and 11% at the top of the resort.
Figure 3 compares the four coastal British Columbia ski resorts in terms of winter rainfall. Two lines are shown for each resort displaying the change in winter rainfall with elevation: the average for 1991 to 2020 and the future forecast for 2090 based on the SSP5-8.5 emission scenario. Cypress will experience an increase in rainfall by 352 mm for its base, 438 mm for mid-elevation, and 516 mm for the peak. Rainfall will increase at Mt Washington by 634 mm at the resort bottom, 571 mm at the resort middle, and 610 mm at the resort top. Sasquatch will experience an increase in rainfall of 652 mm at its base to 624 mm at its peak. For all three of the coastal ski resorts just mentioned, rainfall will become the dominant form of winter precipitation in the future, with snowfall only making up between 0 to 11% of the total precipitation input at their bases and between 19 to 31% of the total precipitation input at their peaks. Finally, Whistler Blackcomb rainfall is predicted to increase by 262 mm at the base, 274 mm at mid-elevation, and 232 mm at the top of the resort.
Copyright © 2026 Michael Pidwirny